Kubernetes + OpenCTI + Splunk Development Environment
Table of Contents
Introduction #
For a while I have been playing around with an OpenCTI homelab using Docker. However, when it comes to container orchestration I always wanted to have a good reason to play around with Kubernetes and wanted to learn how to deploy OpenCTI in a more scalable manner. As I encounter Splunk a lot in my work, I also wanted to learn how to integrate OpenCTI and Splunk. Tearing down and spinning up Docker containers by hand whenever any of my experiments fail is not particularly efficient.
So, instead, let us deploy an OpenCTI and Splunk instance, orchestrated by Kubernetes. This way, we can learn to configure OpenCTI, develop or customize connectors, and also get a feeling for how to integrate OpenCTI with Splunk to consume IOC’s and send any hits back to the TIP!
Minikube + Docker Engine #
Note: If you already have a K8s cluster up and running, feel free to skip this section. #
For the containerization backend, I chose to use Docker Engine. Depending on your platform (I’m on Debian 12), follow the guide here. For learning and development purposes I chose Minikube to administer my cluster as it seemed to be the best out of all alternatives. For installation instructions, see this page. Also, make sure you install Helm to simplify deployment of the charts.
For the sake of brevity, I will not go into installing Docker, Minikube or Helm as this process is pretty straightforward.
Once Minikube is installed, make sure to start it and specify Docker as the driver:
minikube start --driver=docker
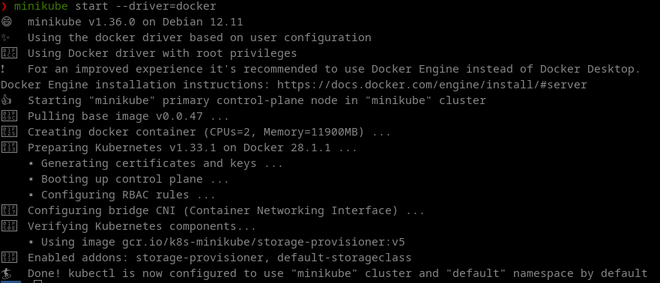
After a while, you should hopefully see that Minikube has been started succesfully:
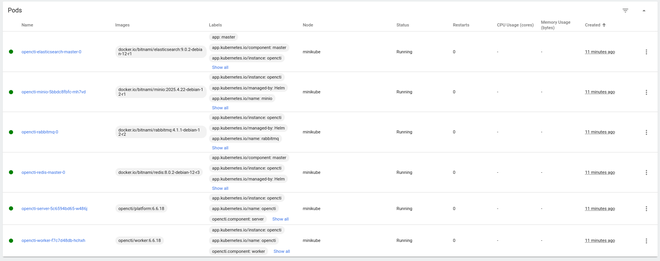
All your pods should be in the Running state:

Optional: Kubernetes Dashboard #
To have a nice overview of the cluster, I like to use the Kubernetes dashboard. It can be installed, started and accessed as follows:
minikube dashboard
If you forgot the URL, run the following:
minikube dashboard --url
Deploying OpenCTI #
The OpenCTI Helm charts can be found here. Before deployment, make sure to read the installation instructions here! We need to at least configure a basic env block, and replace some “release-name” values in the values file! Ofcourse, we also want to enable persistence such that we can store some data in the Elasticsearch backend. I’m using the following values.yaml file to override the defaults. These settings have been optimized for a cluster with very limited resources, so increase the values where you see fit, or remove them to have Kubernetes handle them automatically.
env:
  # APP OPENCTI
  APP__ADMIN__EMAIL: admin@admin.io
  APP__ADMIN__PASSWORD: changeme
  APP__ADMIN__TOKEN: <insert random UUID here>
  APP__BASE_PATH: "/"
  APP__GRAPHQL__PLAYGROUND__ENABLED: false
  APP__GRAPHQL__PLAYGROUND__FORCE_DISABLED_INTROSPECTION: false
  NODE_OPTIONS: "--max-old-space-size=8096"
  PROVIDERS__LOCAL__STRATEGY: LocalStrategy
  # MINIO
  MINIO__ENDPOINT: opencti-minio
  MINIO__PORT: 9000
  MINIO__ACCESS_KEY: user
  MINIO__SECRET_KEY: changeme
  MINIO__USE_SSL: false
  # ELASTICSEARCH
  ELASTICSEARCH__URL: http://opencti-elasticsearch:9200
  # RABBITMQ
  RABBITMQ__HOSTNAME: opencti-rabbitmq
  RABBITMQ__PORT_MANAGEMENT: 15672
  RABBITMQ__PORT: 5672
  RABBITMQ__USERNAME: user
  RABBITMQ__PASSWORD: changeme
  # REDIS
  REDIS__HOSTNAME: opencti-redis-master
  REDIS__PORT: 6379
  REDIS__MODE: single
  # METRICS AND HEALTHCHECK
  APP__TELEMETRY__METRICS__ENABLED: true
  APP__HEALTH_ACCESS_KEY: changeme

elasticsearch:
  enabled: true

  extraEnvVars:
    - name: ES_JAVA_OPTS
      # Important to tune for larger deployments
      value: "-Xms1g -Xmx1g"

  sysctlImage:
    enabled: false

  # You can choose to have a separate master and data ES node, per the defaults
  master:
    masterOnly: false
    replicaCount: 1
    persistence:
      enabled: true
      # Define the Persistent Volume Chain size for storing ES data default for other components (redis, minio etc.) is 8Gi
      size: "100Gi"
    # If you don't specify this, Kubernetes will automatically set them for you
    resources:
      requests:
        memory: "2Gi"
      limits:
        memory: "2Gi"
  data:
    # To have only one combined ES master + data node
    replicaCount: 0
  ingest:
    replicaCount: 0
  coordinating:
    replicaCount: 0


minio:
  enabled: true
  mode: standalone
  auth:
    rootUser: user
    rootPassword: changeme

  persistence:
    enabled: true


rabbitmq:
  enabled: true
  replicaCount: 1
  clustering:
    enabled: false

  auth:
    username: user
    password: changeme
    erlangCookie: changeme

  persistence:
    enabled: true

# Needed to access the server, depending on your configuration
ingress:
  enabled: true
  className: ""
  hosts:
    - host: localhost
      paths:
        - path: /
          pathType: Prefix
      backend:
        service:
          name: opencti-server
          port:
            number: 80
  tls: []
Before we can deploy the Chart, we have to add this repo:
helm repo add opencti https://devops-ia.github.io/helm-opencti
helm repo update
Now, issue the following command to deploy OpenCTI. We are providing the values defined above to configure the deployment. Sometimes it is necessary to specify the –version flag to make sure all components (core and connectors) run the same version of the OpenCTI platform, (i.e. version 6.7.0).
To check which Helm Chart release coincides with which particular version of OpenCTI, check the Github releases page. In this article, I’m using version 1.11.3 of the Chart, which coincides with version 6.6.18, but newer versions are released frequently. The –version flag ensures no pods start running together with different versions of the platform. You can choose any release name for your deployment, but I’m just going with opencti.
helm install -f values.yaml <RELEASE_NAME> opencti/opencti --version 1.11.3
After a good 5-10 minutes, OpenCTI will be fully ready. On my setup, the worker pod usually starts last, and is a good indicator that the platform is fully up and running.
To access OpenCTI, we need to port-forward to the opencti-server pod, as such:
kubectl port-forward <opencti-server pod name> 8080:4000
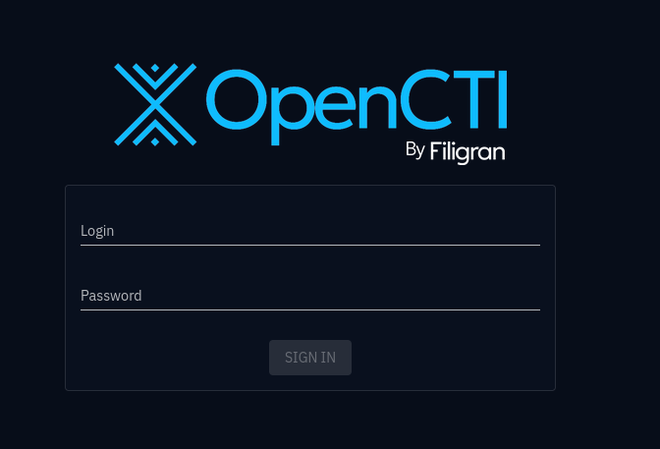
If all went well, OpenCTI will now be accessible on http://localhost:8080 from your host machine:
Deploying Connectors #
To get some useful data in, we can choose form a plethora of connectors, provided by OpenCTI or the community. Let’s try to add the default OpenCTI connector that populates the platform with some data about sectors, organizations and locations. To this end, we specify an additional connectors.yaml file that holds all the connector configurations, with the following content:
TIP: You don’t need to specify the OPENCTI_URL and OPENCTI_TOKEN environment variables, the Helm Chart takes care of this!
connectors:
- name: opencti
  enabled: true
  replicas: 1
  image:
    repository: opencti/connector-opencti
  env:
    CONNECTOR_ID: "<insert random UUID>"
    CONNECTOR_NAME: "OpenCTI Datasets"
    CONNECTOR_SCOPE: "markingdefinition,identity,location"
    CONNECTOR_UPDATE_EXISTING_DATA: "true"
    CONNECTOR_RUN_AND_TERMINATE: "false"
    CONNECTOR_LOG_LEVEL: "error"
    CONFIG_SECTORS_FILE_URL: "https://raw.githubusercontent.com/OpenCTI-Platform/datasets/master/data/sectors.json"
    CONFIG_GEOGRAPHY_FILE_URL: "https://raw.githubusercontent.com/OpenCTI-Platform/datasets/master/data/geography.json"
    CONFIG_COMPANIES_FILE_URL: "https://raw.githubusercontent.com/OpenCTI-Platform/datasets/master/data/companies.json"
    CONFIG_REMOVE_CREATOR: "false"
    CONFIG_INTERVAL: 7 # In days
  resources:
    requests:
      memory: 128Mi
    limits:
      memory: 128Mi
For other connectors, be sure to also check the connector examples provided along with the OpenCTI Helm Chart.
Now upgrade the existing release with the added connectors (while keeping the original values):
helm upgrade -f values.yaml -f connectors.yaml opencti opencti/opencti --version 1.11.3
The new connector pod will appear after a while:

You can also check the status in OpenCTI to ensure some work is being done:

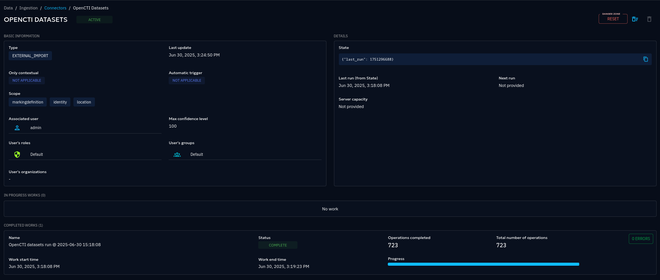
While we’re incorporating connectors, let’s also add some indicators from ThreatFox by adding the connector-threatfox, which will simply download indicators from a publicly hosted CSV file. We add this to the previously mentioned connectors.yaml, which already contains the OpenCTI connector.
- name: threatfox
  enabled: true
  replicas: 1
  image:
    repository: opencti/connector-threatfox
  env:
    CONNECTOR_ID: <insert random UUID here>
    CONNECTOR_NAME: "Abuse.ch | ThreatFox"
    CONNECTOR_SCOPE: "ThreatFox"
    CONNECTOR_LOG_LEVEL: "error"
    THREATFOX_CSV_URL: "https://threatfox.abuse.ch/export/csv/recent/"
    THREATFOX_IMPORT_OFFLINE: "true"
    THREATFOX_CREATE_INDICATORS: "true"
    THREATFOX_INTERVAL: "3" # In days, must be strictly greater than 1
    THREATFOX_IOC_TO_IMPORT: "ip:port,domain,url" # List of IOC types to import
  resources:
    requests:
      memory: 128Mi
    limits:
      memory: 128Mi
Again, upgrade the deployment:
helm upgrade -f values.yaml -f connectors.yaml opencti opencti/opencti --version 1.11.3
Check that the connector gets registered and that the workers start ingesting data:

We should now get some indicators in the platform:

Bonus: Customizing Connectors #
Downloading connectors from an existing repo is great, but sometimes you need to troubleshoot the connector or modify the connector to suit your needs. For this to work, we need to be able to build our own connectors and push them to the Docker registry.
As an example, we clone the OpenCTI connectors repo locally and add some modifications to the ThreatFox connector. Go into the connectors > external-import > threatfox > src subfolder and modify main.py:
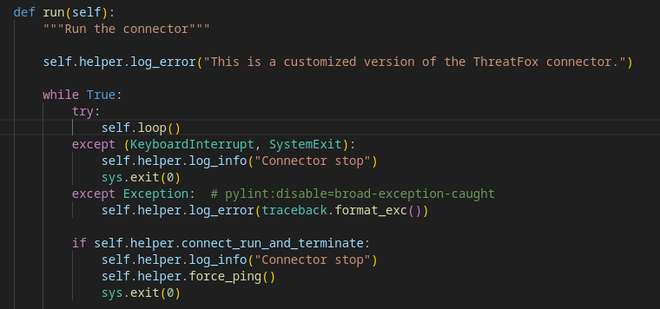
To have this connector available for a Helm upgrade, we have to build the image and push it to the Docker registry. It is important to append the current OpenCTI version to the connector tag of your choosing, as the Helm Chart needs / expects this:
docker build -t connector-threatfox-custom:6.6.18 connectors/external-import/threatfox
Modify connectors.yaml accordingly:
  ...

- name: threatfox-custom
  enabled: true
  replicas: 1
  image:
    repository: connector-threatfox-custom
  env:
    CONNECTOR_ID: <insert random UUID>
    CONNECTOR_NAME: "Abuse.ch | ThreatFox"
    CONNECTOR_SCOPE: "ThreatFox"

  ...
Re-issue an upgrade:
helm upgrade -f values.yaml -f connectors.yaml opencti opencti/opencti --version 1.11.3
Sometimes you need to tear down the connectors first before upgrading again:
helm upgrade -f values.yaml opencti opencti/opencti --version 1.11.3
If you get Image pull errors, consult this page. You might need to run the following command in your current terminal.
eval $(minikube docker-env)
If all went well and the connector pod runs smoothly, issue the following command to get the logs and check whether your customization worked:
kubectl logs <pod name>
Or check the Kubernetes Dashboard:

We can modify the code and rebuild the connector for development. Deletion of the pod will pull the new image with the modifications.
kubectl delete -n default pod <pod name>
Deploying Splunk #
Now that OpenCTI is up and running, including some data to start off with, we can deploy Splunk to test the integration. Luckily, Splunk Operator makes this as easy as running the following Helm Chart to deploy Splunk in a new namespace. See this guide to get started.
kubectl apply -f https://github.com/splunk/splunk-operator/releases/download/2.8.0/splunk-operator-namespace.yaml --server-side
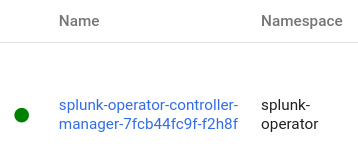
Next, we need to actually deploy a Splunk instance:
cat <<EOF | kubectl apply -n splunk-operator -f -
apiVersion: enterprise.splunk.com/v4
kind: Standalone
metadata:
  name: s1
  finalizers:
  - enterprise.splunk.com/delete-pvc
EOF
To access the web interface, we once again need to port-forward to open port 8000
kubectl port-forward <splunk s1 pod name> 8000 -n splunk-operator
To find the admin password, we need to perform some additional steps. Run this command to find the admin password:
kubectl get secret <secret name> -o go-template='{{range $k,$v := .data}}{{printf "%s: " $k}}{{if not $v}}{{$v}}{{else}}{{$v | base64decode}}{{end}}{{"\n"}}{{end}}' --namespace splunk-operator
You will get the following output, and need to use the password entry to login at localhost:8000 with admin:password.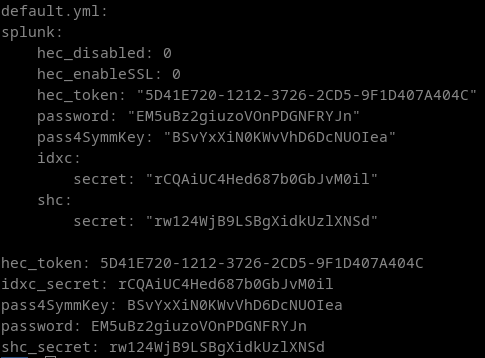
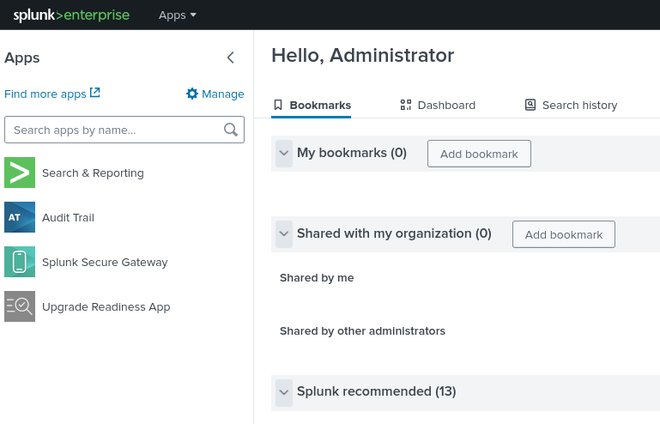
Congratulations, we now have OpenCTI and Splunk up and running. Time to integrate the two!
Deploying Splunk OpenCTI Add-On #
Before you install the OpenCTI Add-On from the Splunk Apps Browser, we need to make a minor adjustment such that it accepts an HTTP URL rather than only HTTPS in the configuration. First, clone the add-on from this Github repo.
In the TA-opencti-add-on > bin folder, edit TA_opencti_add_on_rh_settings.py. We need to modify the regex used to validate the OpenCTI instance URL. Around line 100, replace “http” with “https”.
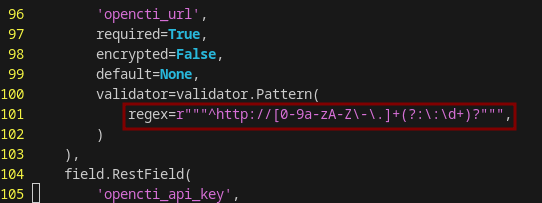
Once we are done, zip or tar the TA-opencti-add-on folder and head over to the Splunk apps > manage apps > install app from file, upload the zip file and restart Splunk.
Note: after you restart Splunk, you might need to re-enable the port-forward to port 8000!
Sending indicators from OpenCTI to Splunk #
Before we start configuring the add-on we need to enable data sharing in OpenCTI. Go to Data > Data sharing and add a new stream. For development purposes, I’m just going to make it public. Make sure to start the stream and copy the stream ID. Head back over to Splunk and go to Apps > OpenCTI Add-On for Splunk > Inputs and add a new input. Configure it with the stream ID you just copied.
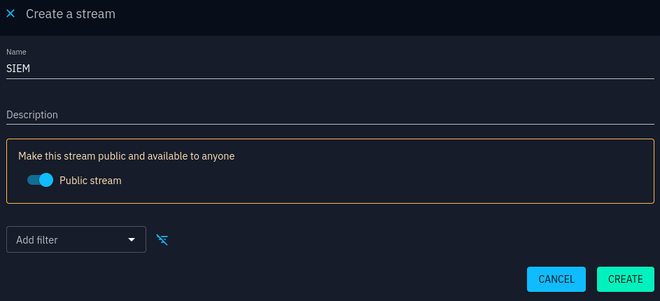

Now get the OpenCTI Server internal IP by issuing:
kubectl get pods -o wide

Go back to Apps > OpenCTI Add-On for Splunk > Configuration > Add-on Settings and set the OpenCTI URL to http://<pod ip address>:4000.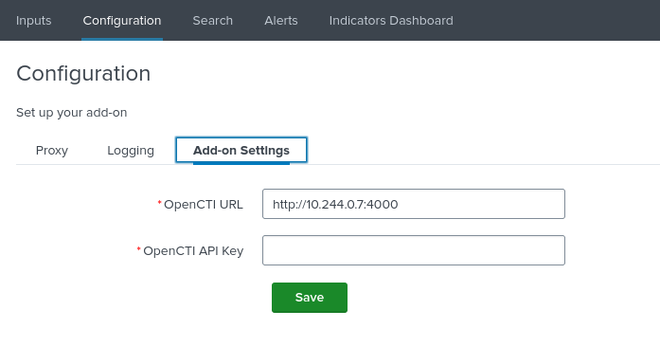
Retrieve your OpenCTI API key from your Profile page: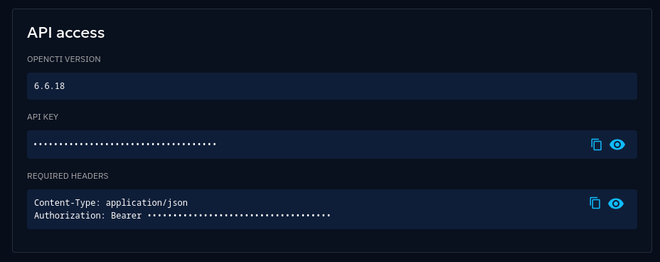
Hopefully, you will quickly see indicators appearing in the Add-On Indicator Dashboard, showing that the integration works!
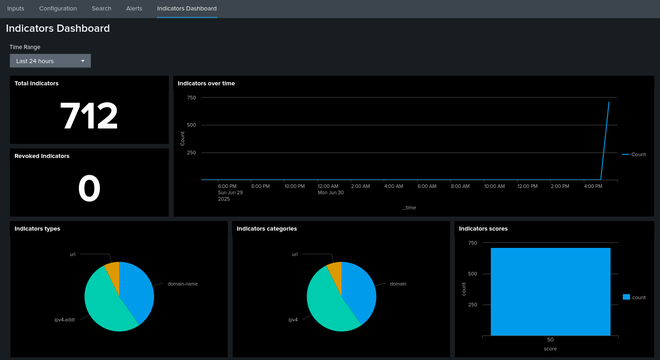
If you have issues ingesting OpenCTI data into the Add-on, check the error logs. The source name comes from the Input name that was previously configured (opencti in this instance). You can also go to Inputs > open input dropdown > “Show (input name) input events”, which will run the following search.
index=_internal source=*opencti* | sort _time
Sending sightings from Splunk to OpenCTI #
To create some sort of feedback loop, we can also send back sightings (incidents) to OpenCTI whenever an indicator has been observed in the logs. This allows to further investigate the sighting in the TIP, capture trends, or in the case of a false-positive hit, remove the indicator to clean up the outgoing feed. We can test this mechanism as follows.
In Splunk go to settings > Searches, reports and alerts > New Alert. We will create a simple alert with the following search, on a Cron schedule of once per minute “* * * * *”:
| makeresults
| eval url="baddomain.com", description="This is a very bad domain, please investigate"
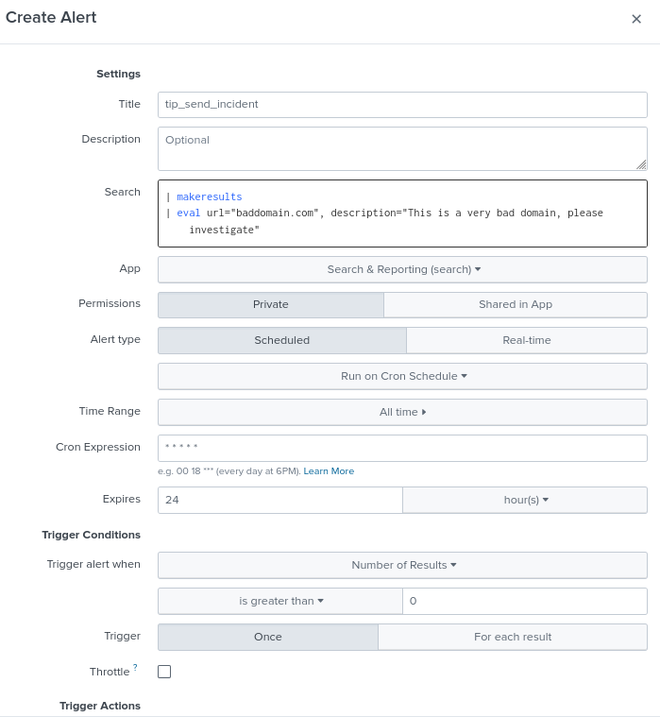
Under Trigger Actions add “OpenCTI - Create Incident” with the following settings:
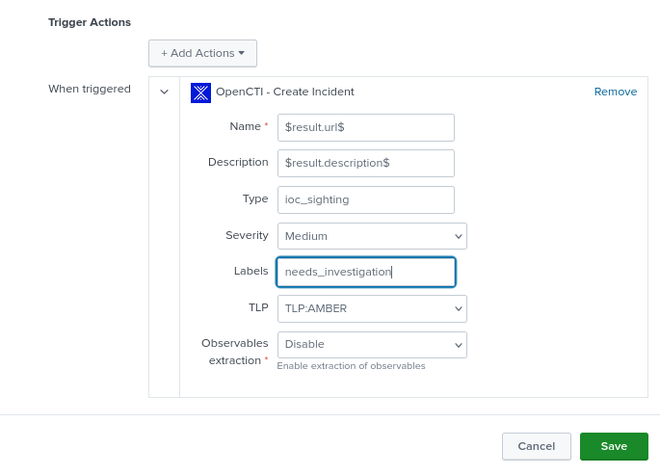
Now head over to OpenCTI Events > Incidents and check out the newly created incidents!

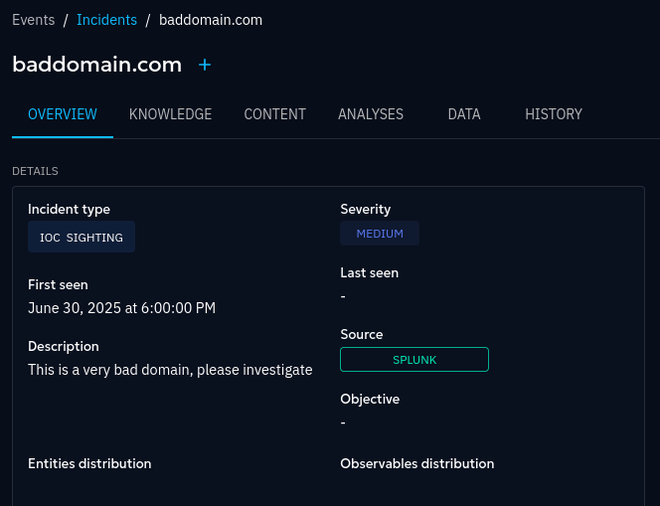
Now we have closed the loop between the TIP and the SIEM, which allows to develop detection logic for the indicators, build dashboards, experiment with connectors, and taking any hits back to the TIP for further investigation.
Conclusion #
Kubernetes is great for experimenting and quickly setting up labs like these. Seeing how smoothly two platforms integrate like this makes me very happy. For the full configuration files, please see this Github repo.
That’s it for now, thanks for sticking with me until the end with this quite lengthy article, and as always, please do not hesitate to contact me with any questions or suggestions. Have a good one!